操作环境
操作系统:Windows 10 家庭版 64 位
Android Studio 版本如图 1:
说明
Android Studio 的版本经历了几次更新,导致 ADM (Android Device Monitor) 的打开方式也发生了几次变化,因此,在网络上找怎么打开 ADM 的话可能会发现没法在自己的 Android Studio 上重现他们的方法,这主要是 Android Studio 的版本不同导致的,建议大家在参考本文的时候也查看一下自己的 Android Studio 的版本(我的文章基本都会注明“操作环境”). 但是,版本不同不表示操作方法一定不同,具体还需要根据实际情况确定。
Google 从 Android Studio 3.2 开始就完全弃用了 Android Device Monitor, 相关解释的原文地址如下:
https://developer.android.com/studio/profile/monitor
相关解释的原文摘抄如下:
Android Device Monitor was deprecated in Android Studio 3.1 and removed from Android Studio 3.2. The features that you could use through the Android Device Monitor have been replaced by new features. The table below helps you decide which features you should use instead of these deprecated and removed features.
来自:https://developer.android.com/studio/profile/monitor
参考中文译文如下:
Android Device Monitor (ADM) 从 Android Studio 3.1 开始不赞成使用,在 Android Studio 3.2 上已经移除了 Android Device Monitor. 你之前可以在 Android Device Monitor 上使用的功能都被新的功能代替了。下面的表格将帮助你判定哪些功能是被替换和移除了。
译自:https://developer.android.com/studio/profile/monitor
不过,ADM (Android Device Monitor) 在 Android Studio 3.4.1 版本中仍然存在。此外,目前网络上大部分介绍在 Android Studio 中打开 Android 虚拟机中的文件的方式仍然是使用 ADM 的 File Explorer. 所以,知道如何打开 ADM 仍然很有必要,接下来就是具体的操作步骤。
操作步骤
根据 Android Studio 官网的信息,下面的操作步骤适用于 Android Studio 3.1 及其之后的版本。
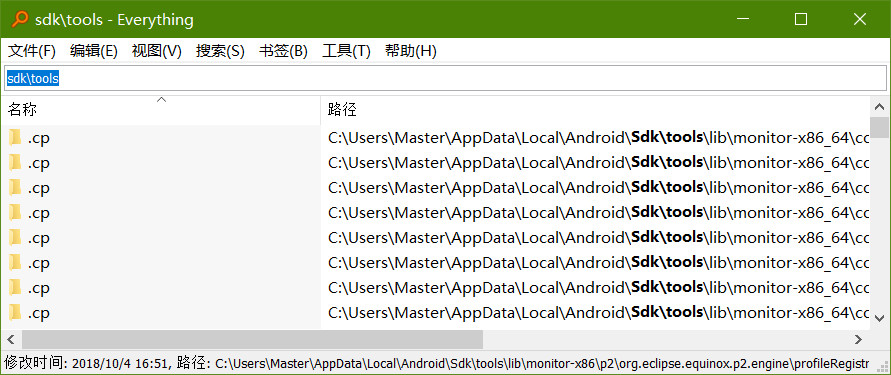
使用 Everything 搜索 “sdk\tools” 可以找到 Android SDK 的路径:
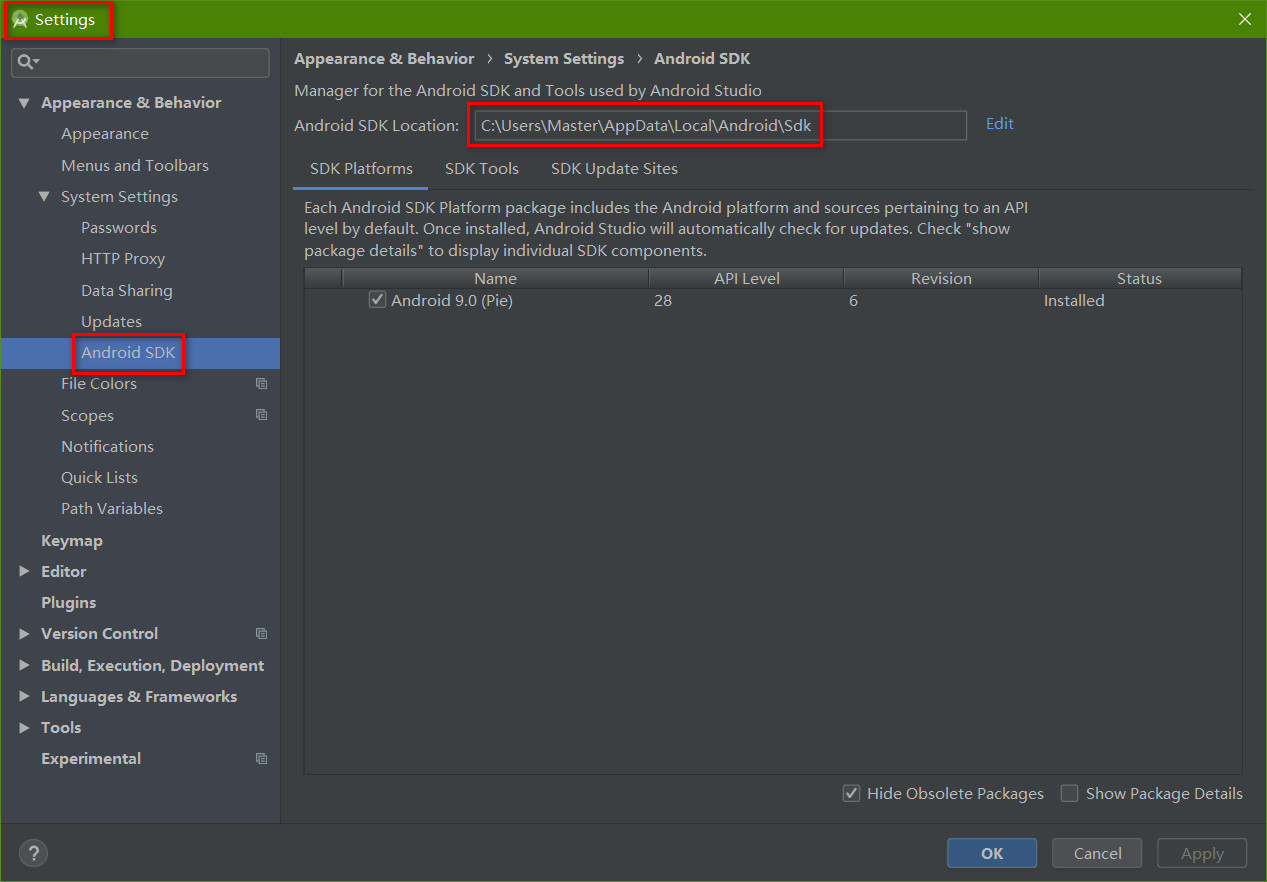
或者在 Android Studio 中依次打开 “File / Settings / Android SDK” 中查看 Android SDK 的路径:
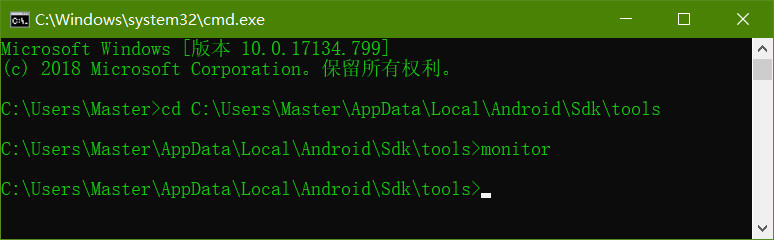
在 CMD 中进入 Android SDK tools所在的路径并输入 monitor 指令,即可打开 Android Device Monitor:
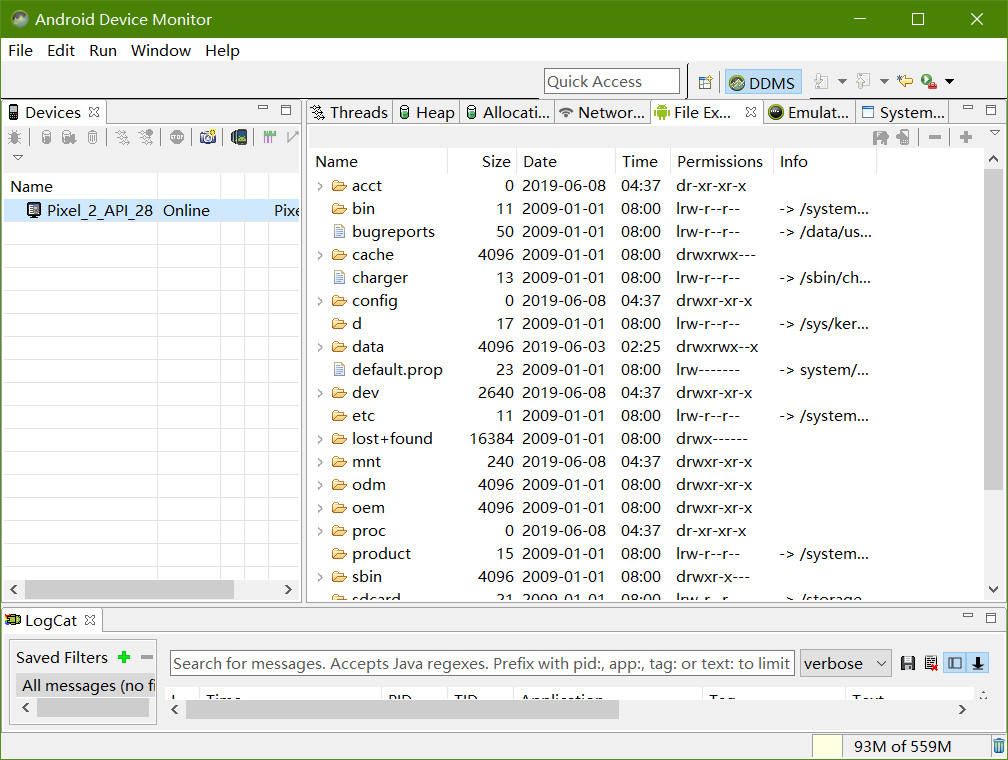
Android Device Monitor 的界面:
EOF